Contents of this page:
1. Introduction
2. Sources of information / data
Climate and microclimate
Geographic information system, GIS
Electronic atlas
3. Analysis and simulation tools
3.1 Strategic tools
3.2 Physical tools
- ENVIMET
- N3S
- SOLENE
- ECOTECT
- Virtual shade cast
- Solar envelope
- WMS
- TRANSMIS
- MOBILITY
4. Study in depth
1. Introduction
With technical progress in computers and software,
new analysis and working tools become available. These are complementary
to the traditional tools and working schemes used in town-planning.
Although a general tool which covers all the aspects of energy planning
on an urban zone or district scale does not exist, a considerable
number of methods, tools and data sources can efficiently contribute
right now to city planning.
One can classify these tools in two main groups:
1) Data bases and sources of information:
- Climate databases
- GIS, geogrphic information systems
- Topography
These tools will gradually replace data available
through traditional paper support. Their advantage lies in a greater
flexibility and precision. The centralization of data allows for
correlation, synthetic analysis and interpretation by the immediate
availability and the possibility of superposition of several information
layers.
2) Analysis and simulation tools:
Strategic tools
- Tools for analysis and planning
- Evaluation of development strategies
- Risk assessment and management
Physical tools
- Computational fluids dynamics, CFD: gas (winds) and fluids
(water)
- Evapotranspiration, microclimate
- Solar access, potential for use of solar energy
- Transport and mobility
In fact, these tools are limited to a restricted
number of parameters or phenomena. However, the recourse to these
tools makes it possible to answer precise questions.
Geographical information systems,
GIS, are the basis for urban design since they are capable of covering
very varied aspects such as energy, solar accesses, hydrology, traffic,
energy infrastructures and networks...
All these tools are a useful complement
for the work of the architect and town planner.
However the interactivity between
these various tools remains generally weak because of the huge complexity
of the problems to solve. The relatively naive idea to be able to
integrate sufficient "intelligence" into software in order
to make them usable to the layman is a lure; this is only possible
for relatively simple and very precise tasks. The user will always
need knowledge to interpret and validate the relevance of results.
This is all the more true as the growing complexity of problems
necessarily calls upon a certain specialization.
It is most important that the user has some
knowledge of the theoretical bases in order not to be induced into
error by appearances. Source: Simos Yannas, AAGS, 2001
The list of tools proposed here below
is far from being exhaustive. With the risk to appear somehow technocratic,
the goal is to illustrate some possibilities which are available
to the architecte and urbanist enabling him to approach the energy
and ecological aspect of city planning.
2. Sources of information / data
Climate & microclimate
The data of temperature, solar
radiation, wind, precipitations, etc... will significantly condition
the urban form, the requirements imposed on the infrastructures,
the potentialities for alternative energies...
Climate databases
METEONORM integrates a data base of more than 2500
stations and 360 cities all over the world. The software can generate
monthly or hourly values for any point defined by its geographical
co-ordinates.
Various standard output formats are available,
others can be defined by the user.
Website>>> http://www.meteotest.ch
Analysis of climatic data
THE WEATHER TOOL is a visualisation and analysis
program for hourly climate data. It provides a wide range of display
options, including both 2D and 3D graphs as well as wind roses and
sun-path diagrams.
Add to this full psychometric processing
and you have a unique mechanism for assessing the relative potential
of different passive design systems. Add solar radiation analysis
and you can then accurately determine optimum orientations for specific
building design criteria.
Website >>> http://www.squ1.com
GIS, geographic information systems
The knowledge of the territory
is a fundamental basis of any urban project. Through history, various
supports were used to materialize this knowledge: oral transmission,
popular knowledge, traditional paper and files and, more recently,
computers and data bases.
A geographical information system, GIS, is a data-processing
tool that makes it possible to represent and analyze all the things
which exist on a geographical scale as all the events which occur
there.
GIS offer all the possibilities of conventional
data bases (such as requests and statistical analyses) through visualization
and analysis specific to geographical charts. These capabilities
make GIS an unique tool that is accessible to a very large audience
and addressing itself to a very large variety of applications.
GIS software offers the tools and the functions
to store, analyze and display all kind of information. The dataset
is certainly the most important component of the GIS: geographical
data and associated tabular data of geological, hydrological, legal
information, networks, infrastructures, statistics, harmful effects...
and more generally any information correlated to a place.
Display of geographical and environmental
data layers
Source: http://www.esri.com
(august 2005)
ArcView is an example of GIS software - website >>
http://www.esri.com
Applications
SITG, "système d'information du
territoire genevois"
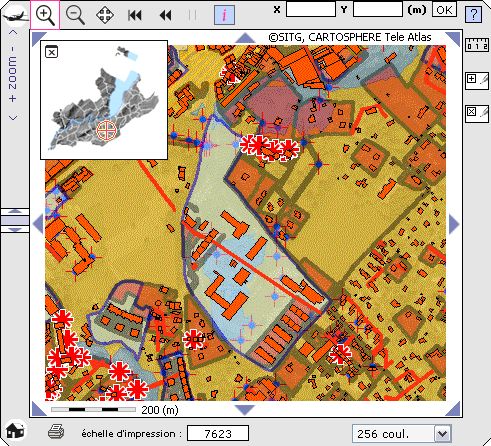
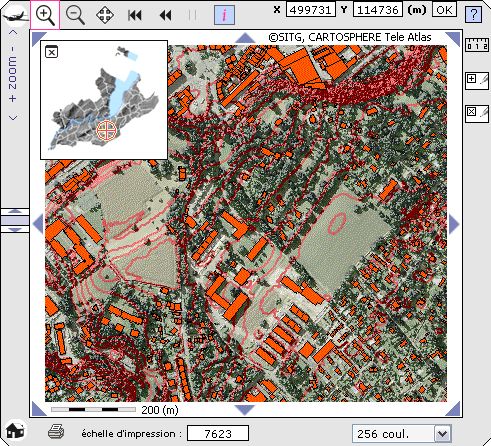
Examples of information on the site of Battelle
Source: http://www.sitg.ch/
(2005)
SITG website >>> http://www.sitg.ch/
Other links:
Electronic altlas
In the same way as GIS, electronic
atlases may provide useful territorial information, such as climatic
data, statistical data, geological, ecological and topographic information...
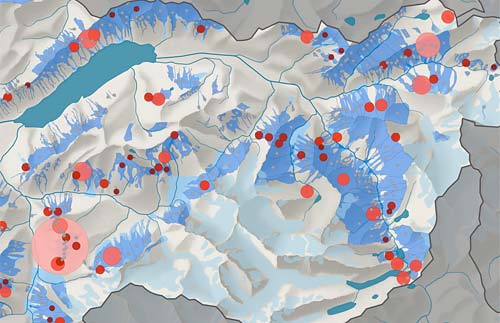
Avalanche inventory: Berne
Population density
Source: http://www.atlasofswitzerland.ch/
(2005)
The “Atlas of Switzerland”
is a joint project of the ETH Zurich’s Institute of Cartography,
the ETH Board, the Swiss Federal Statistical Office (SFSO) and the
Swiss Federal Office of Topography (swisstopo).
Website >> http://www.atlasofswitzerland.ch/
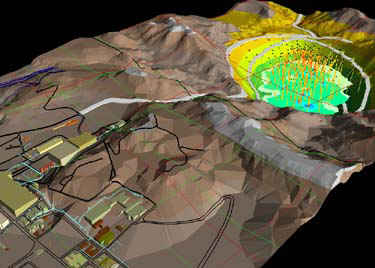
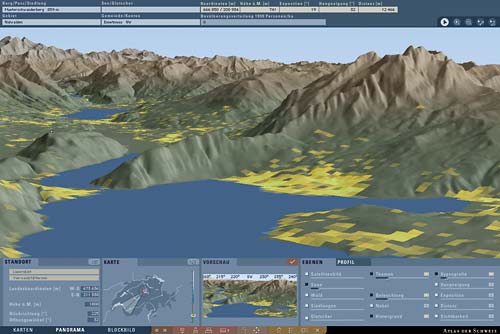
Topography
These are three dimensional ground- and city models,
generally generated by air or satellite photography. These models
can be used as support for the evaluation of solar accesses, winds
or as GIS backgrounds in order to represent data in three dimensions.
Swissphoto - website >> http://www.swissphoto.ch/
3 Analysis and simulation tools
3.1 Startegic tools
Strategic decision tools allow
for analysis of medium or long term development scenarios. They
are not strictly simulation tools but rather methodologies used
to evaluate options or strategies by a series of (ecological) indicators.
They are equally suitable during the follow-up of the development.
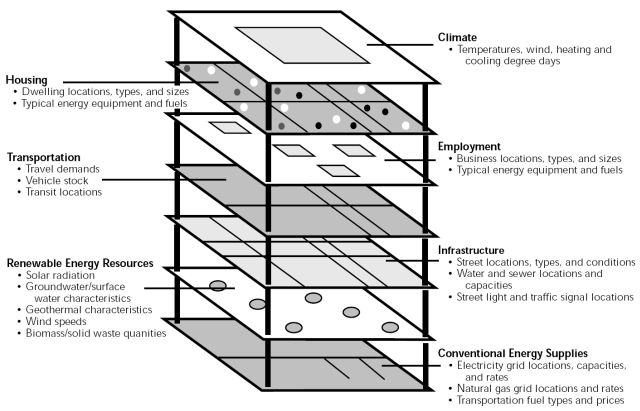
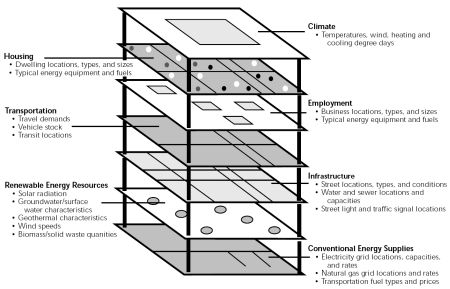
PLACE3S
PLAnning for Community
Energy, Economic and Environmental
Sustainability, is a land use and urban design
method created specifically to help communities understand how their
growth and development decisions can
contribute to improved sustainability.
The PLACE3S approach to urban planning
uses energy accounting to evaluate the efficiency with which we
use our land, design our neighbourhoods to provide housing and jobs,
manage our transportation systems, operate our buildings and public
infrastructures, site energy facilities, and use other resources.
PLACE3S uses energy accounting as a uniform language to bring together
a diverse set of stakeholders. It provides maps and focused data
to educate the public and decision makers about the effects of their
choices on their community. The outcome is a well-informed, inclusionary
public process that balances community values and integrates environmental,
economic and social goals.
Study in depth >> Create Sustainable Communities
with PLACE3S
Handbook_PLACES_3_Create_Sustainable_Communities.pdf
http://www.energy.ca.gov/places/
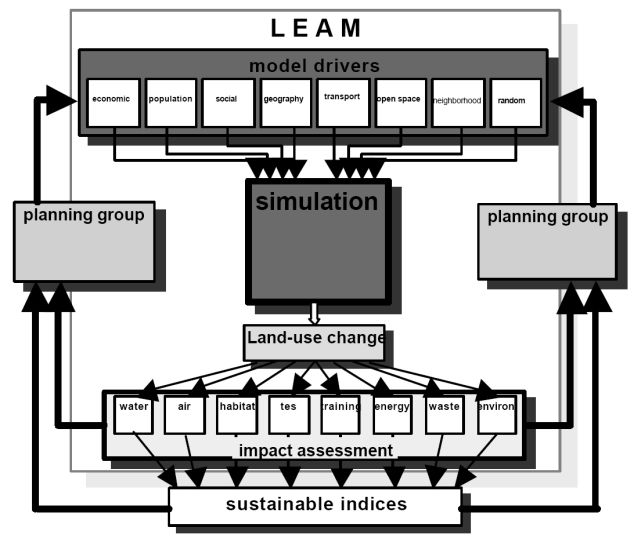
LEAM
The Land Use Evolution
and Impact Assessment Model
The Land use Evolution and impact
Assessment Model (LEAM), utilizes a collaborative environment adapted
for the purpose of developing a Spatial Decision Support System
(SDSS) to evaluate human development patterns. LEAM describes land-use
changes across a landscape that result from the spatial and dynamic
interaction among economic, ecological, and social systems in the
region on a 30 x 30m grid.
It enables planners, policymakers,
interest groups and laypersons to visualize and test communal decisions
and their consequences.

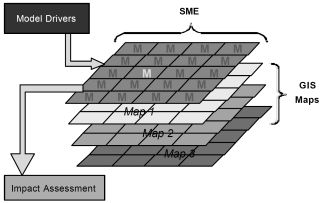
Source: http://www.leam.uiuc.edu/
Output: GIS maps or movies show the transformation
of the subject landscape as a product of policy related inputs.
Further reading >>>
http://www.leam.uiuc.edu/
3.2 Physical analysis tools
The analysis of solar access, radiation and air movements
allow for better understanding of the urban microclimate. The control
of air flows and hygrothermic phenomena in the vicinity of buildings
has a direct incidence on the comfort of public spaces which contributes
to a significant degree to the quality of life in cities. To a lesser
extent, a good management of the urban microclimate can reduce the
requirements of heat or cold of buildings.
Dynamic microclimatic model, evapotranspiration

ENVI-met is a three-dimensional microclimate
model designed to simulate the surface-plant-air interactions in
urban environment with a typical resolution of 0.5 to 10 m in space
and 10 sec in time.
ENVI-met is a prognostic model based
on the fundamental laws of fluid dynamics and thermo- dynamics.
The model includes the simulation of:
- Flow around and
between buildings
- Exchange processes of
heat and vapour at the ground surface and at walls
- Turbulence
- Exchange at vegetation
and vegetation parameters
- Bioclimatology
- Particle dispersion
Website >>> http://www.envi-met.com/
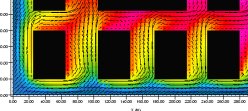
Computational fluids dynamics, CFD
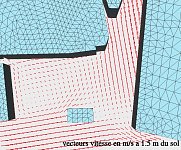 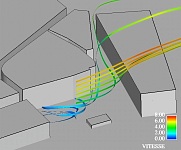
N3S simulates the flows of air and the fields of
pressure around and inside buildings. This software is based on
the finite element method. One can couple the wind turbulence with
thermal equations. The computer model makes it possible to treat
complex geometries such as buildings and small urban islands.
Website >>> http://www.cerma.archi.fr/
Hydrology, flood zones, erosion
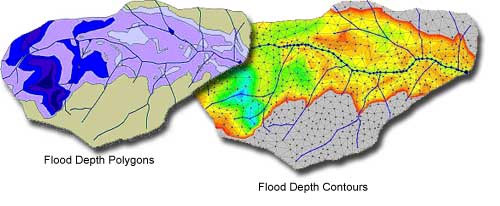
The Watershed Modeling System (WMS)
is a comprehensive graphical modeling environment for all phases
of watershed hydrology and hydraulics. WMS includes tools to automate
modeling processes such as automated basin delineation, geometric
parameter calculations, GIS overlay computations (CN, rainfall depth,
roughness coefficients, etc.), cross-section extraction from terrain
data...
Similar models are able to evaluate
the thermal and ecological impact of a racking or rejection of heat
or cold in a lake or a river.
Website >>> http://www.scientificsoftwaregroup.com
Solar access, irradiation potentials
The control of solar accesses
is significant to comfortable urban microclimates and to guarantee
the potential of use of solar energy for thermal applications (direct
thermal contributions and thermal collectors) or the decentralized
production of photovoltaic electrical current.
Solar radiation potential and illumination
SOLENE is an open question and answer system, proposed
in a graphic interface and organized around sophisticated simulation
algorithms which make it possible to apprehend the architectural
or urban layouts through solar, luminous and thermal parameters.
Connection to industrial software is possible via
the Autodesk Lightscape format.
Website >>> http://www.cerma.archi.fr
Analysis of solar access, incoming solar
irradiation, solar geometry
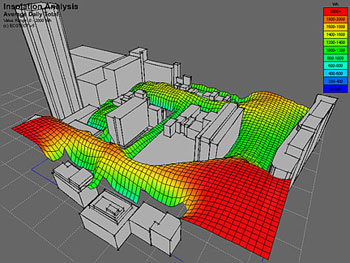
ECOTECT produces a very complete simulation of
solar geometry. The software also allows for evaluation of incident
energy on any given surface. A link via the DXF-format towards industrial
drafting packages makes it possible to export geometries which were
created with the built-in 3D editor.
Website >>> http://www.squ1.com
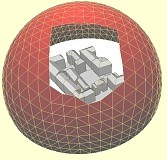
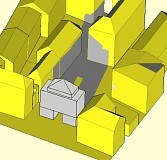
Virtual shade cast
CAD software which integrate a 3D modeller are
ready to carry out considerable analyses in connection with solar
geometry. Some integrate tools making it possible to visualize shadows
for a given place, date and time.
By generating axonometric sights of the building
or urban model from the suns' position, all invisible parts exactly
correspond to the shaded parts and surfaces.
This representation not only makes it possible
to highlight exposed surfaces, but also allows to evaluate the exposure
of a surface over the day and the seasons. Three periods are representative
of the behavior of the building in temperate climates:
- winter solstice, 21 déc - optimization of the solar
contributions, good penetration and irradiation of interior
and external spaces
- equinoxes March 20 21 seven, semi-season - direct solar gains,
good management of glare problems
- summer solstice, June 21 - protection of the sun - thermal
and visual comfort
Calculations are carried out relatively easily
by applying the algorithms given by the following links:
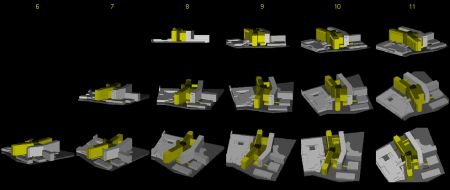
Solar envelope
The solar envelope is a way to assure
urban solar access for both energy and quality of life (Knowles
and Villecco, 1980). The solar envelope regulates development within
imaginary boundaries derived from the sun's relative motion.
The solar envelope is an imaginary volume which
covers the site with a virtual roof. The slopes of its facets are
adjusted in such kind to avoid shades on the vicinity for a predefined
period. A manual construction method using AutoCAD is described
by Thanos N Stasinopoulos in the following link:
Website >>> http://www.ntua.gr/arch/geometry/tns/solenvelope/
Urban Housing Over Commerce: Solar envelopes
(left) replaced by student designs (right) viewed from east.
Source: Ralph L. Knowles 1999
Study in depth >>> http://www-rcf.usc.edu/~rknowles/sol_env/sol_env.html
Transport et mobility
Transport is the consequence
of the spatial dissociation of the leisure and dwelling, production
and employment. By accounting for 30% of energy consumption in Switzerland,
transport is the primary source of noise and pollution in the cities
- integration of transport in town-planning from the very beginning
is necessary.
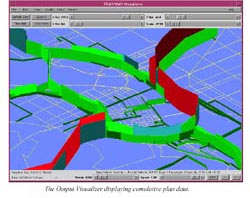
TRANSIMS modules
Source: http://www.sim.inf.ethz.ch/papers/cse-adam-02/html/
Simulation of traffic fluxes
- traffic impacts
- energy consumption
- traffic congestion
- land use planning
- traffic safety
- intelligent vehicle efficiencies
- emergency evacuation
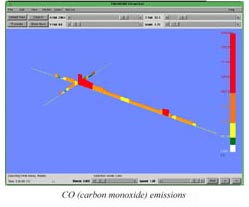
Website >>> http://www.ccs.lanl.gov/transims
Space / time mapping
Multidimensional scaling and space
time mapping is a powerful tool for mobility analysis and planning
Didactic traffic simulation game

Design an attractive, economically
and ecologically sustainable environment for your citizens. Get
to know alternative concepts and administer the local public transport
network ... The measures that can be taken to influence traffic
(roads, traffic regulation schemes, public transport systems, car
sharing...); the options for spatial planning and the environmental
impact of decisions taken are all based on professional models created
by transport and urban planners. MOBILITY is a result of the scientific
support for the project by the Weimar Bauhaus University and the
traffic research department of DaimlerChrysler AG, Stuttgart.
Website >>> http://www.mobility-online.com
Link page: http://www.trafficlinq.com/software.htm
Simulation applet: http://www.mtreiber.de/MicroApplet/index.html
4. Study in depth
The solar envelope
http://www-rcf.usc.edu/~rknowles/sol_env/sol_env.html
Create Sustainable Communities with PLACE3S
Handbook_PLACES_3_Create_Sustainable_Communities.pdf
http://www.energy.ca.gov/places/
pg / 02-02-2006 / mailto
|